Project Objectives and Challenges
To create a UI Style guide for object-oriented eco-system and design and lead the development of various company tools that supercharged the Homeowners Insurance Business Processes including Quoting, Underwriting, Claims, and Agent Relationships.
Project Galleries
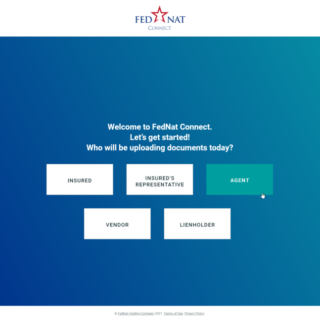
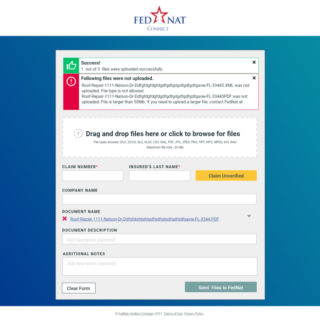
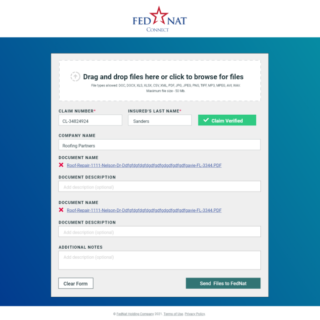
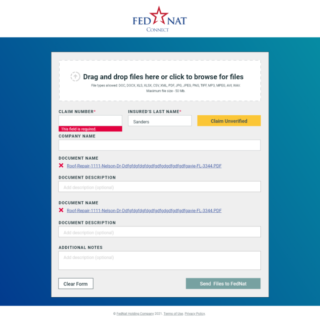
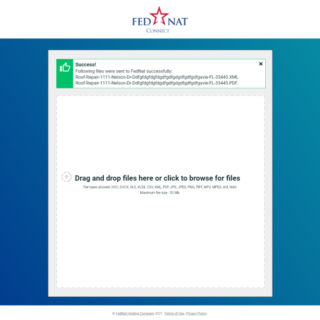
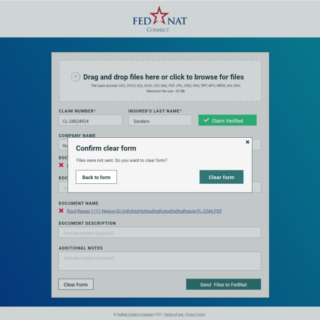
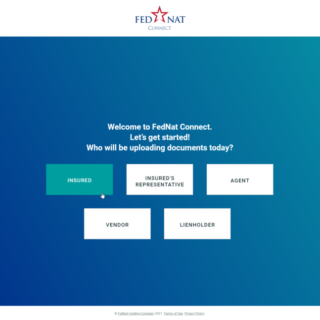
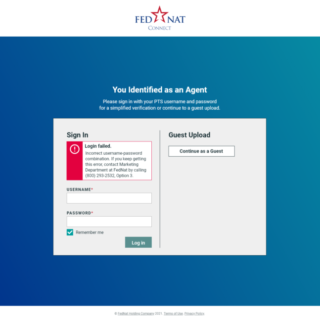
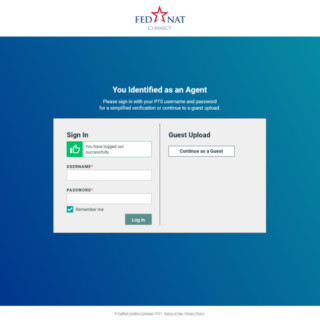
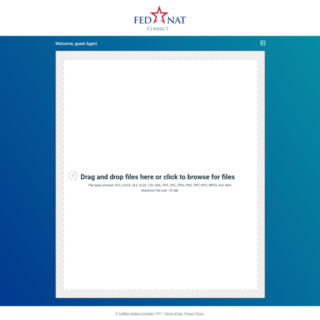
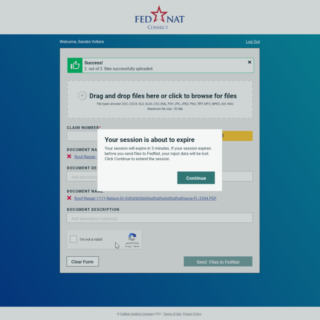
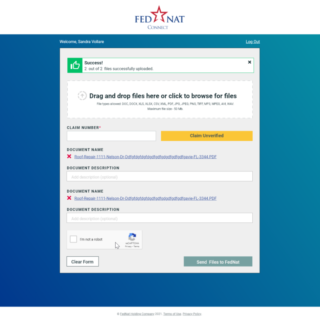
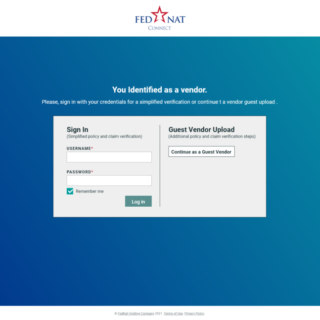
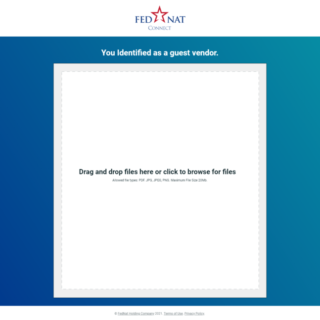
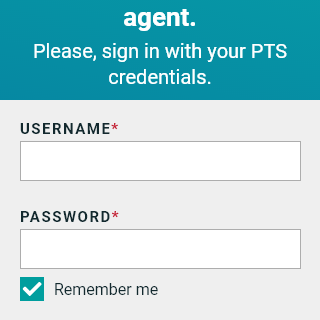
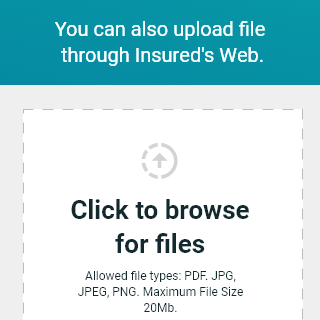
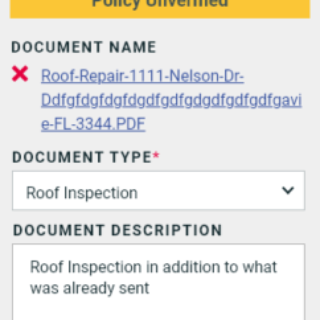
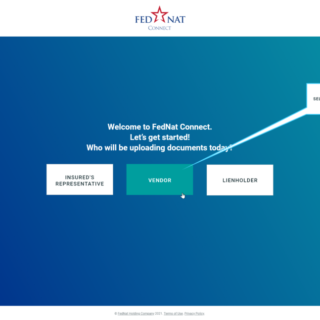
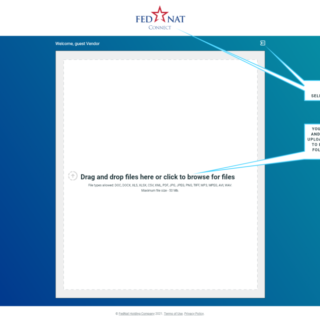
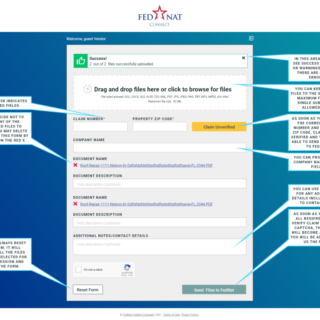
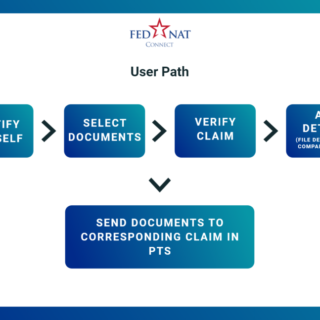
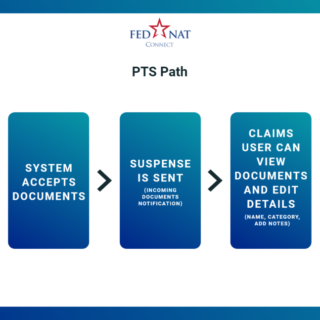
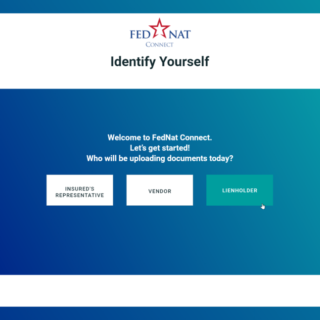
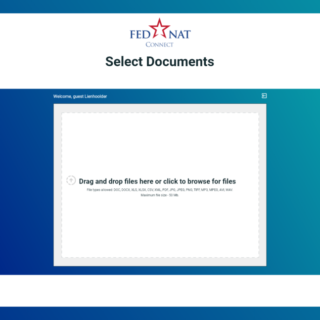
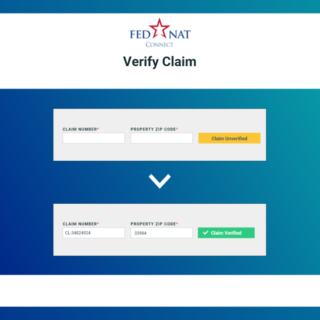
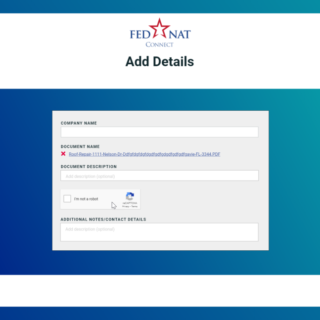
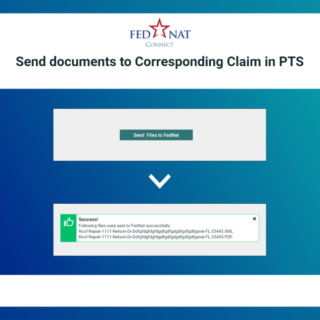
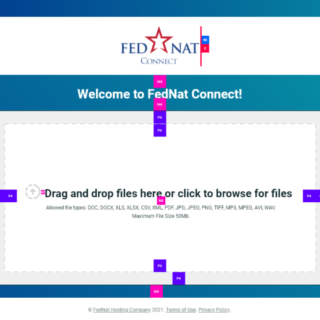
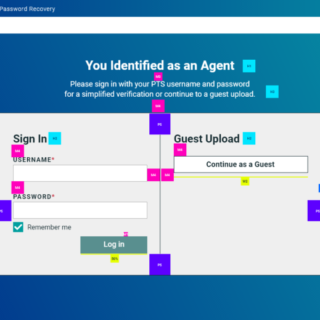
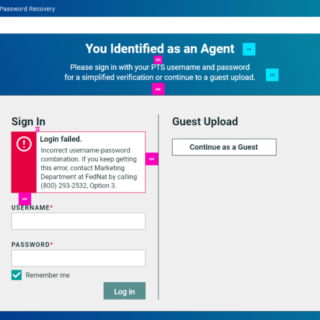
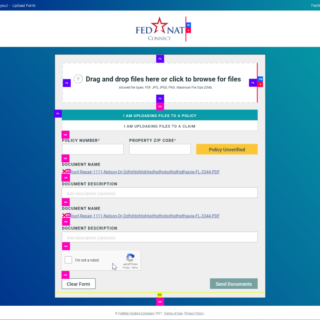
Product Launch – Connect – An Insurance Documentation Submission Tool and Manual
Connect Stakeholder Presentation
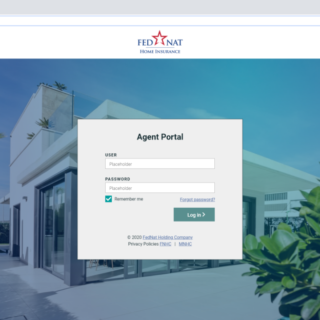
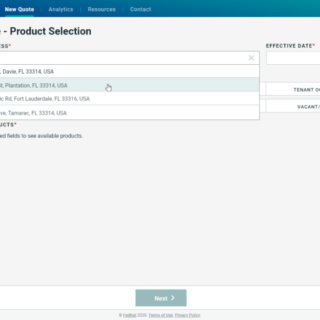
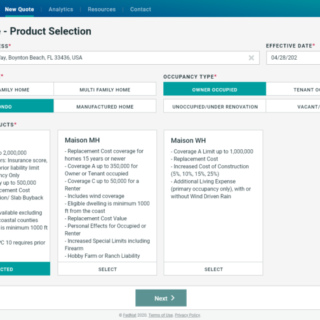
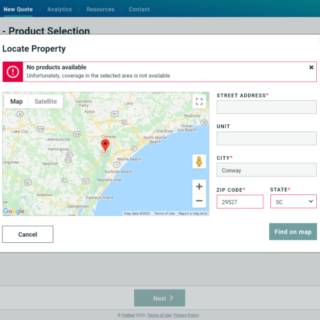
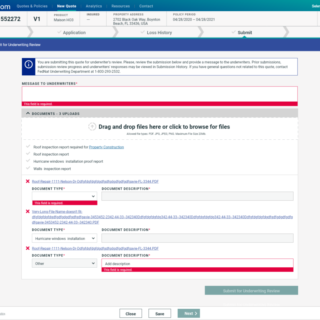
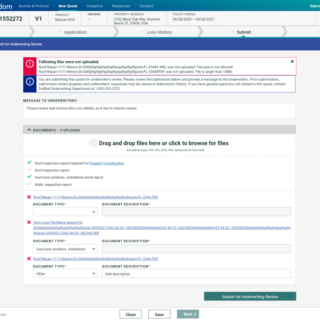
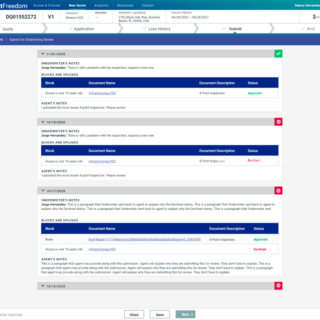
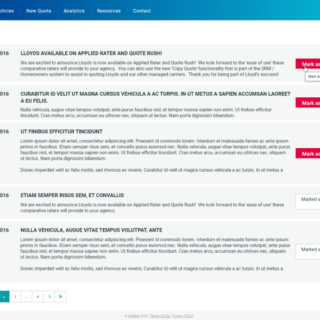
System Optimization – B2B Homeowners’ Insurance Agent Quoting and Underwriting Tool – Sample Screens
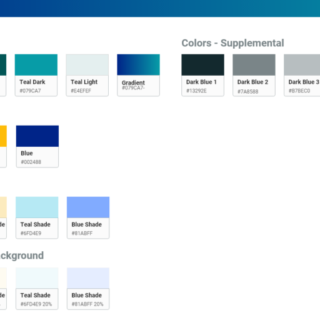
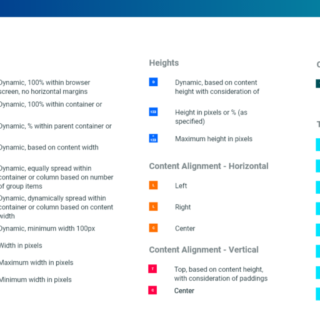
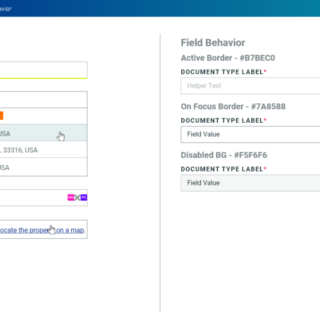
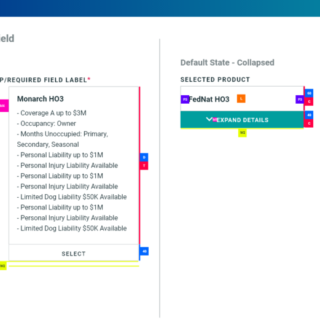
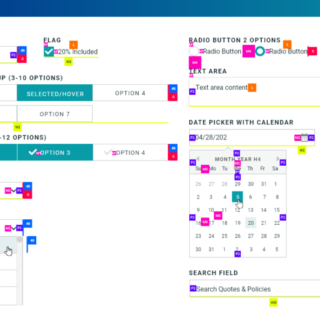
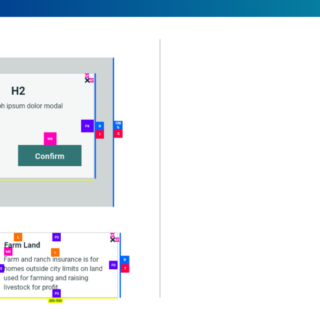
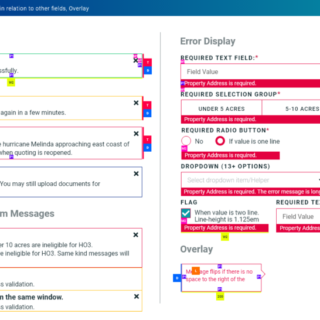
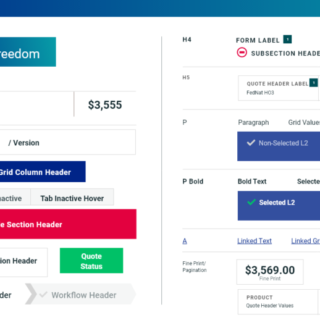
UI/UX Style Guide
Documentation Samples
Tasks
- Conducted technical, marketing stakeholder and end user workshops
- Led business requirements gathering sessions
- Created Product roadmaps
- Developed use cases, epics, and user stories
- Documented product specifications, including MVP
- Owned backlog and roadmap, including epics and user stories
- Led unit and end-to-end testing (UAT/SIT, Pre-release testing)
- UI/UX Design and Management in an Object-Oriented environment including comprehensive Style Guide creation.
- Led Agile team through development, testing, and release management, including mixed in-house and off-shore Scrum teams
- Managed production of data management system
- Power BI Report Creatin using DAX
- Managed Legacy CMS
Methodologies
- Agile
- Scrum/Kanban
- User Acceptance Testing (UAT)
- Pre-release testing
- Hypercare testing
- Testing workshops
- System and Business Process Optimization
- Stakeholder Relationships and alignment
- Strategy and technology alignment
- Business requirements gathering
- End user feedback integration
Tools
- Project Management and Development Tools
- Jira (for backlog management, user stories, defect tracking)
- Confluence (for documentation and collaboration)
- UI/UX Design Tools
- Adobe XD (for UI/UX design)
- Communication and Collaboration Tools
- Slack (for team communication)
- Zoom (for virtual workshops and meetings)
- Microsoft Teams (for collaboration and communication)
- Data Management and Reporting Tools
- SQL Server (for data management)
- Power BI (for reporting and data visualization)
- Excel (for data analysis and reporting)




No responses yet